Tipss_Bse_Nse - 14/7/06 Chart - 3
 Dear all
see the Lesson - 1 how works. Nifty fails to manage to main tain the above level of 3129, see the arrow in right top lower top, then down nifty by 3120 from 3139.
regds
SIVA
Dear all
see the Lesson - 1 how works. Nifty fails to manage to main tain the above level of 3129, see the arrow in right top lower top, then down nifty by 3120 from 3139.
regds
SIVA
Dear all
see the Lesson - 1 how works. Nifty fails to manage to main tain the above level of 3129, see the arrow in right top lower top, then down nifty by 3120 from 3139.
regds
SIVA
Yours
Tipss_Bse_Nse
at
3:23:00 PM
0
comments
![]()
Dear All
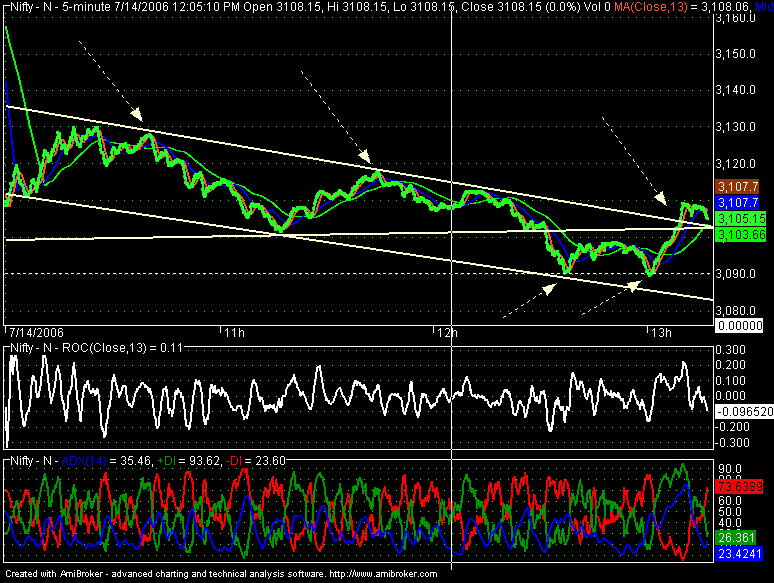
Any one will compare with first chart, then see the down trend line crack of nifty. See the double bottom support at 3090. Then our target will achieve. and also see the neck and neck fight at 3129 by bulls and bears. once it crossed then up up up for our second target.
regds
SIVA
Yours
Tipss_Bse_Nse
at
1:47:00 PM
1 comments
![]()
 dear all
See the nifty inside the down trend line, if nifty crosses 3117 then 3129-3140-3151
regds
SIVA
dear all
See the nifty inside the down trend line, if nifty crosses 3117 then 3129-3140-3151
regds
SIVA
Yours
Tipss_Bse_Nse
at
11:56:00 AM
0
comments
![]()
 Dear all
See the previous day resistance level line acted a support and nifty form the double bottom support at 3150 so nifty goes up straight to 3177.
regds
SIVA
Dear all
See the previous day resistance level line acted a support and nifty form the double bottom support at 3150 so nifty goes up straight to 3177.
regds
SIVA
Yours
Tipss_Bse_Nse
at
3:16:00 PM
0
comments
![]()
 dear all
Nifty manage to cross the major resistance 3167 after 1 hour.
see the exact Fibonacci resistance at 3180, our on line client get the exact level 3180
before half an hour. See the second arrow crack the down trend from 3167. the next level is 3202.
regds
SIVA
dear all
Nifty manage to cross the major resistance 3167 after 1 hour.
see the exact Fibonacci resistance at 3180, our on line client get the exact level 3180
before half an hour. See the second arrow crack the down trend from 3167. the next level is 3202.
regds
SIVA
Yours
Tipss_Bse_Nse
at
2:24:00 PM
0
comments
![]()
 Dear all
see up trend violation in nifty at 3167 and lower top formation at 3163
nifty come down major resistance at 3167. be cautious.
regds
SIVA
Dear all
see up trend violation in nifty at 3167 and lower top formation at 3163
nifty come down major resistance at 3167. be cautious.
regds
SIVA
Yours
Tipss_Bse_Nse
at
1:26:00 PM
0
comments
![]()
 Dear all
Every one says after getting our first chart it is not true, market towards 3160.
what happened again from 3138 to 3103 [-35]. compare with our fist chart.
regds
SIVA
Dear all
Every one says after getting our first chart it is not true, market towards 3160.
what happened again from 3138 to 3103 [-35]. compare with our fist chart.
regds
SIVA
Yours
Tipss_Bse_Nse
at
2:40:00 PM
0
comments
![]()
 Dear all
See the uptrend violation and formation of lower top and
as per our lesson -1 down nifty by 30 points from first arrow
we will see the second one.
regds
SIVA
Dear all
See the uptrend violation and formation of lower top and
as per our lesson -1 down nifty by 30 points from first arrow
we will see the second one.
regds
SIVA
Yours
Tipss_Bse_Nse
at
12:56:00 PM
0
comments
![]()
 Dear all
i told if nifty cross 3120 then 3146
another exact day for us
http://in.groups.yahoo.com/group/Tipss_Bse_Nse/
regds
SIVA
Dear all
i told if nifty cross 3120 then 3146
another exact day for us
http://in.groups.yahoo.com/group/Tipss_Bse_Nse/
regds
SIVA
Yours
Tipss_Bse_Nse
at
4:43:00 PM
0
comments
![]()

Dear all
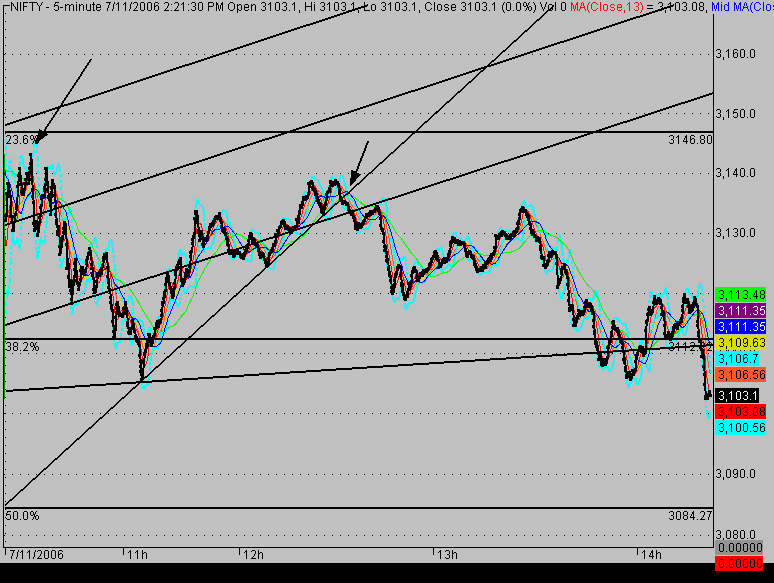
compare with previous chart i said that from second arrow in top market may come down,then nifty touch low 3084 from 3118 [34 points].
Then fibonacci support 3084 work as support then market up
enjoy the trend lines and support levels
regds
SIVA
Yours
Tipss_Bse_Nse
at
2:42:00 PM
0
comments
![]()
 Dear all
Another form of lower top
market may fall
regds
SIVA
Dear all
Another form of lower top
market may fall
regds
SIVA
Yours
Tipss_Bse_Nse
at
1:49:00 PM
0
comments
![]()
 Dear All
The arrow indicate the crack the down trend line and that indicates the buy signals and resistance level of 3112 now support level, then nifty go up side upto 3120. but that is the major resistance level nifty attempt to cross over very actively. If crosses then 3146 - 3160
regds
SIVA
Dear All
The arrow indicate the crack the down trend line and that indicates the buy signals and resistance level of 3112 now support level, then nifty go up side upto 3120. but that is the major resistance level nifty attempt to cross over very actively. If crosses then 3146 - 3160
regds
SIVA
Yours
Tipss_Bse_Nse
at
12:27:00 PM
0
comments
![]()
 Dear All
CMP Nifty 3075 [cash]
if nifty fails to maintain to this level then fall upto 3056 - 3047 - 3016
we expect the bearish trend in intraday and high volatility
if nifty maintain 3075 then major resistance at 3084 - 3093 - 3111 - 3131
regds
SIVA
Dear All
CMP Nifty 3075 [cash]
if nifty fails to maintain to this level then fall upto 3056 - 3047 - 3016
we expect the bearish trend in intraday and high volatility
if nifty maintain 3075 then major resistance at 3084 - 3093 - 3111 - 3131
regds
SIVA
Yours
Tipss_Bse_Nse
at
9:34:00 AM
0
comments
![]()
 Dear all
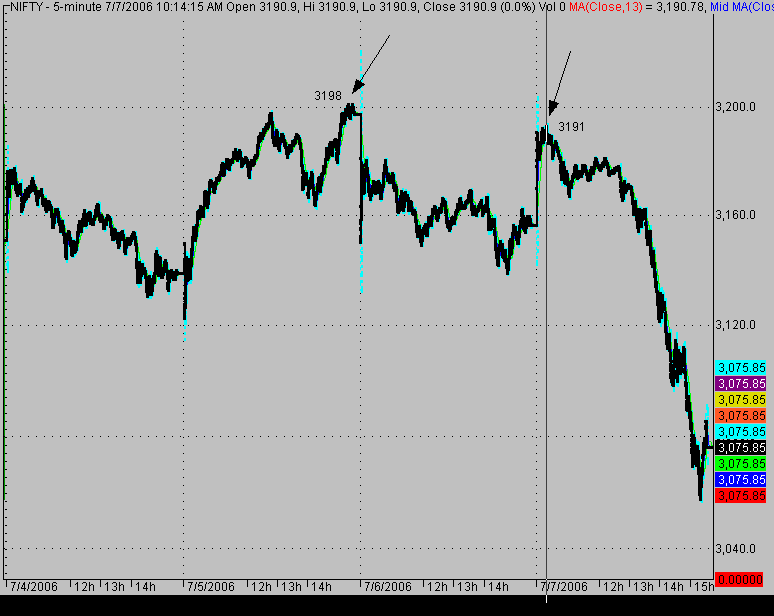
See the High on 5/7/06 is 3198. On 6/7/06 & 7/7/06 Nifty fails to go above the previous high of 3198 and form the lower top 3191. So, every formation of lower top or fails to cross the previous high will create panic. What happened on 7/7 formation of lower bottom 3056.
This gives the formation of another lower top and lower bottom. This sign the bearish trend. So, be cautious on your long trend, two days back we already told the be cautious status for long.
regds
SIVA
Dear all
See the High on 5/7/06 is 3198. On 6/7/06 & 7/7/06 Nifty fails to go above the previous high of 3198 and form the lower top 3191. So, every formation of lower top or fails to cross the previous high will create panic. What happened on 7/7 formation of lower bottom 3056.
This gives the formation of another lower top and lower bottom. This sign the bearish trend. So, be cautious on your long trend, two days back we already told the be cautious status for long.
regds
SIVA
Yours
Tipss_Bse_Nse
at
1:57:00 AM
1 comments
![]()


