Friday, September 15, 2006

15/9/06 Chart - 2

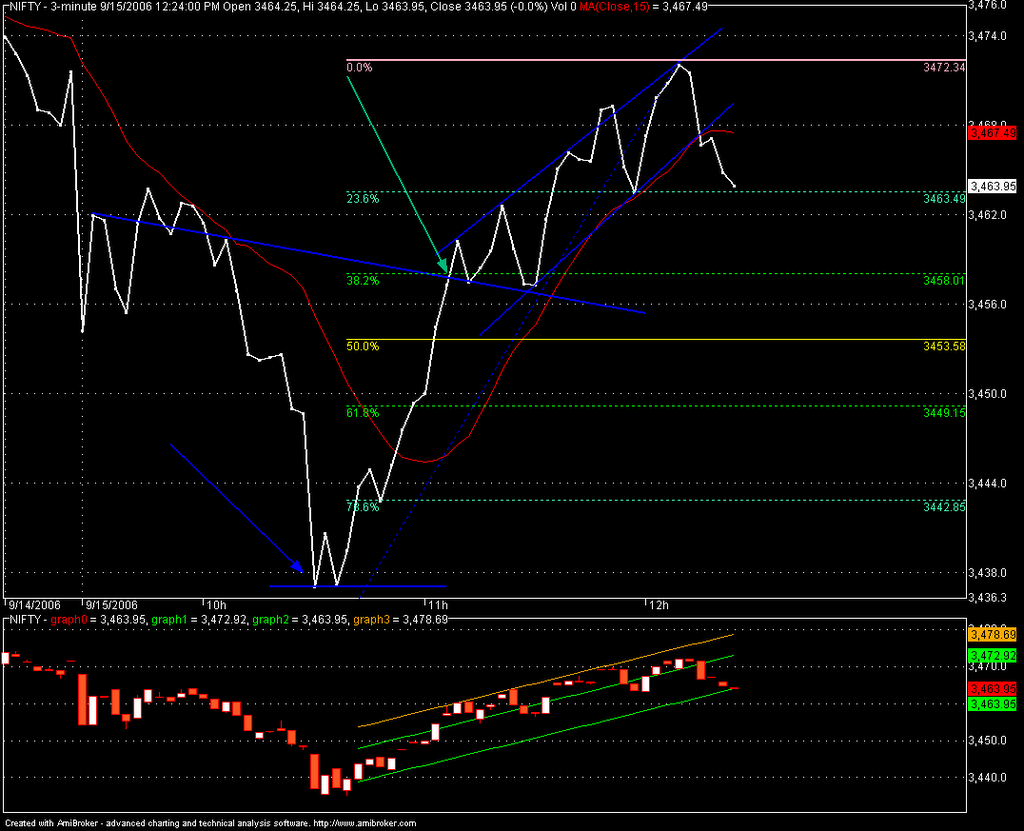
Dear All Again Bearish flag formation. See the double bottom formation at 3437, marked by blue arrow. Then nifty form the bullish indication. [only 5 points difference to our previous post. enjoy]. At 3457 marked by [green arrow] violation of down trend line. So, nifty form the bullish indication. Also nifty form double top at 3471. So, BUY nifty only above 3473. regds / SIVA

15/9/06 Chart - 1

Dear All Bearish flag formation, Double top at 3473 and ROC, RSI not favour to nifty. SELL NIFTY arround 3490 with a sl of 3500. Support 3452-3429. Resistance 3473-3489. regds / SIVA

Tuesday, September 12, 2006

12/9/06 Chart - 2

Dear All Reverse H&S formed by nifty. So, Nifty will touch 3418. ( Head low 3328 high 3376, difference 48. Penetrate at 3370, So total 3370+48=3418. Buy Nifty [previously only 14 points difference for our bearish. we predict 3314. but nifty form 3328. regds / SIVA

12/9/06 Chart - 1

Dear All, Nifty CMP-3366.15. From the low of 2932 nifty reached high 3502. As per Elliot Wave theory minimum of 33% retracement and maximum of 66%. Nifty Support at 3331-3314 [min 33% of increase. So, nifty touch 3314 first. SELL NIFTY. regds / SIVA